Iteration Reports
Iteration Reports
Burn-up and Burn-down charts that provide real-time insights into iteration-level performance for Agile teams.
Key elements include:
- Sprint Goal completion
-
Velocity trends
- Blockers and issues
- Team capacity vs load
The purpose is to support continuous improvement and help teams stay on track with iteration goals.
Iteration Reports – Burn-Down
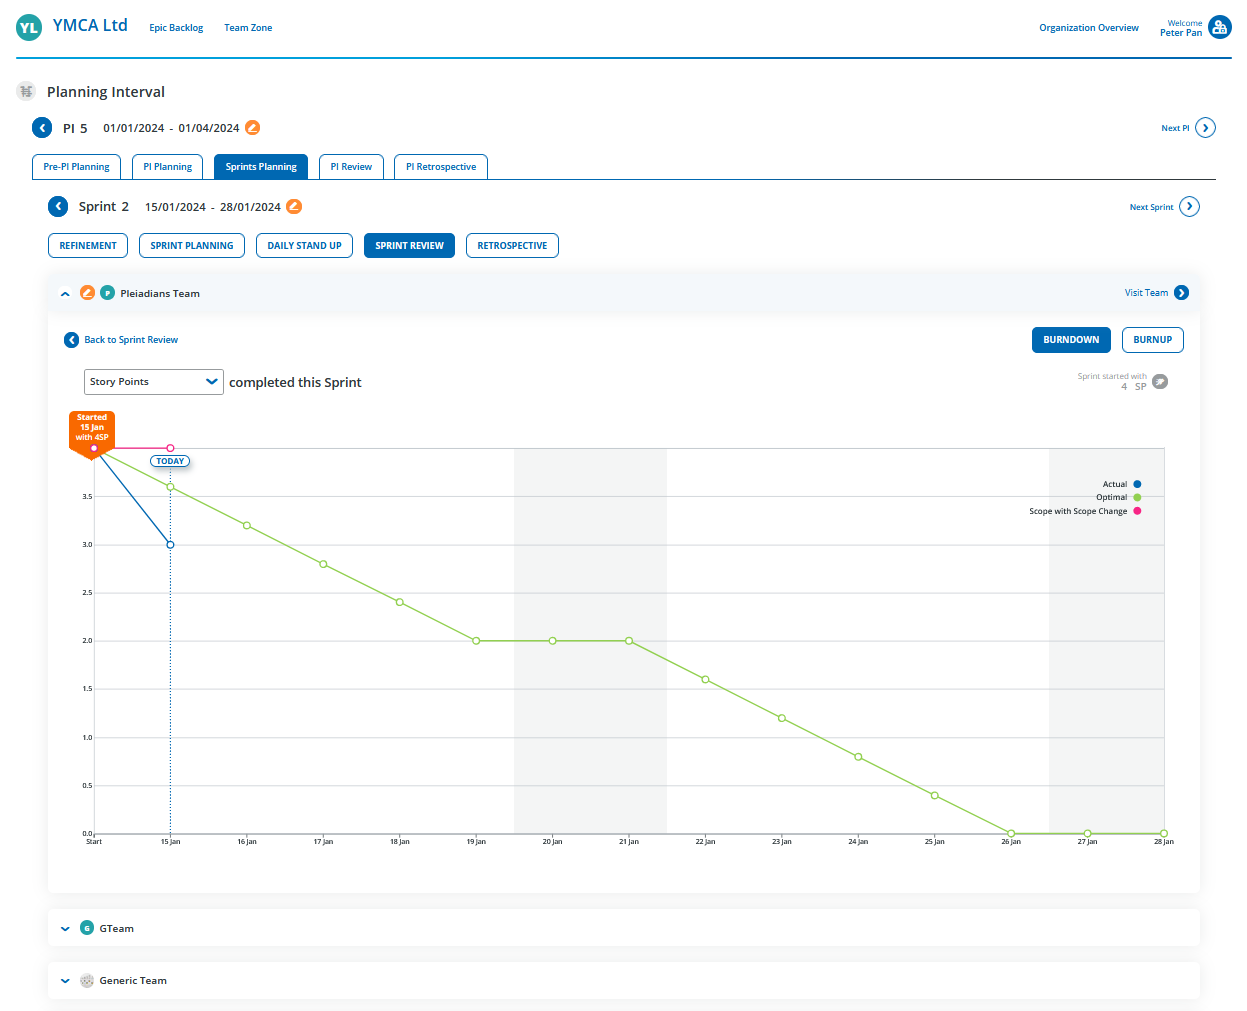
Burn-down Chart
Show how much work remains in an Iteration.
Key elements include:
- If work is being completed on time.
- If the team is ahead or behind schedule.
- Scope creep (if User Stories and tasks suddenly increase).
- Bottlenecks and/or blockers.
Iteration Reports – Burn-Up
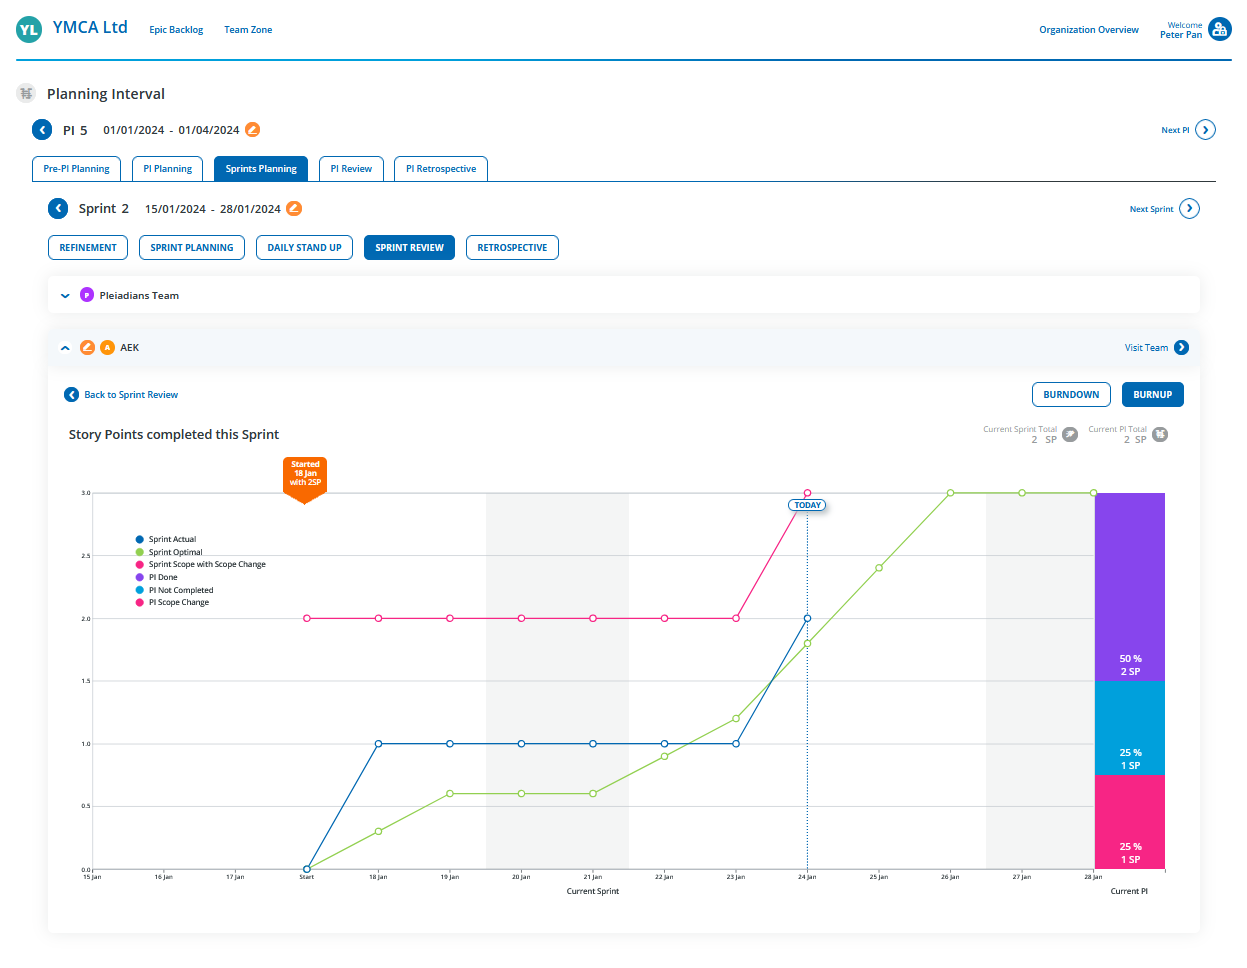
Burn-up Chart
- Progress toward goals.
- Scope changes during the Iteration execution.
- Whether the team is on track to finish.
- Additionally offers the tracking of the Planning Increment scope and progress, which shows added or removed scope over time.


