Planning Interval Reports
Fully automated PI Reports
Track overall progress and outcomes across the entire PI (typically 3 months), helping align execution with business objectives and OKR’s.
Key elements include:
-
Planned vs. Actual delivery at Feature, User stories and Objective level.
-
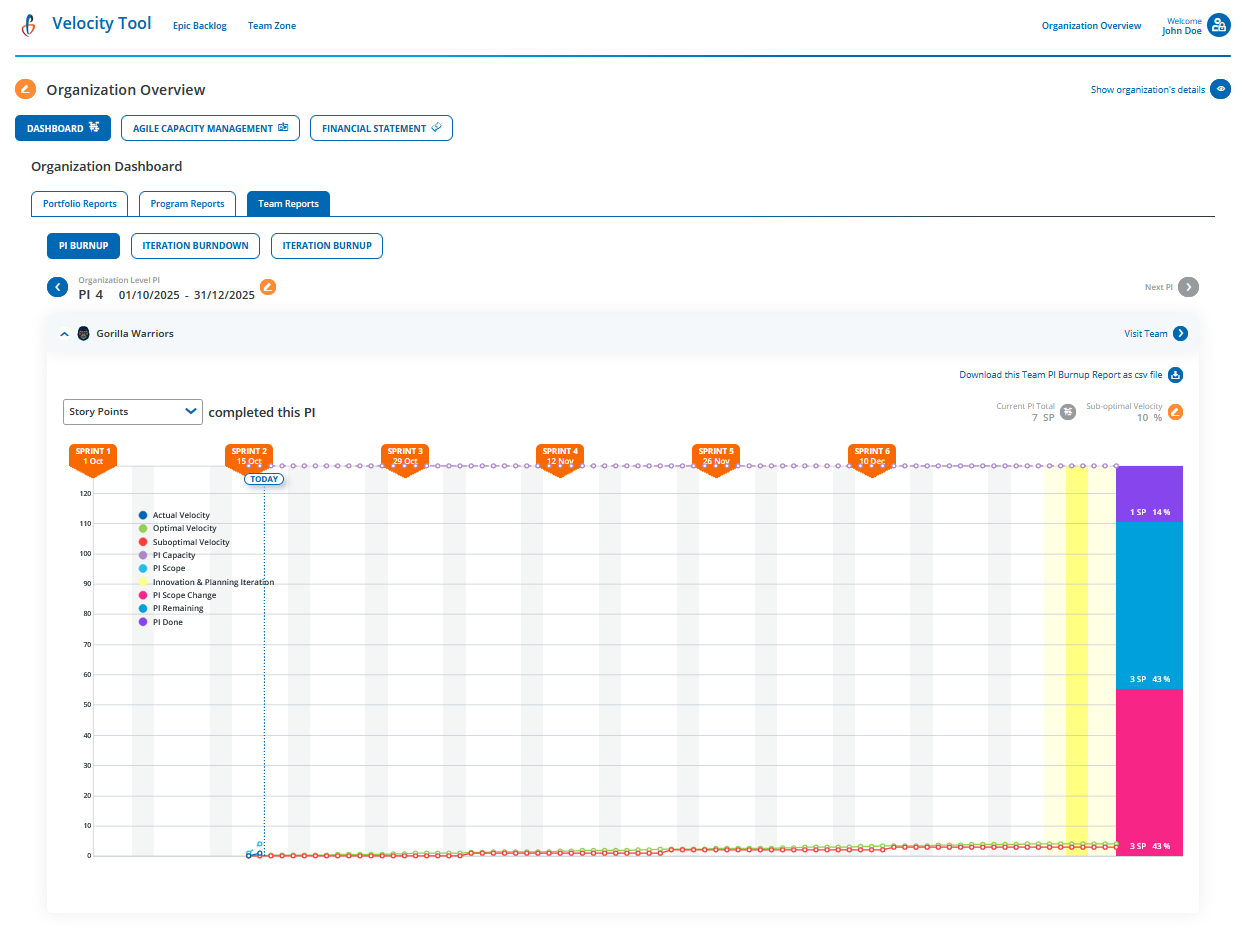
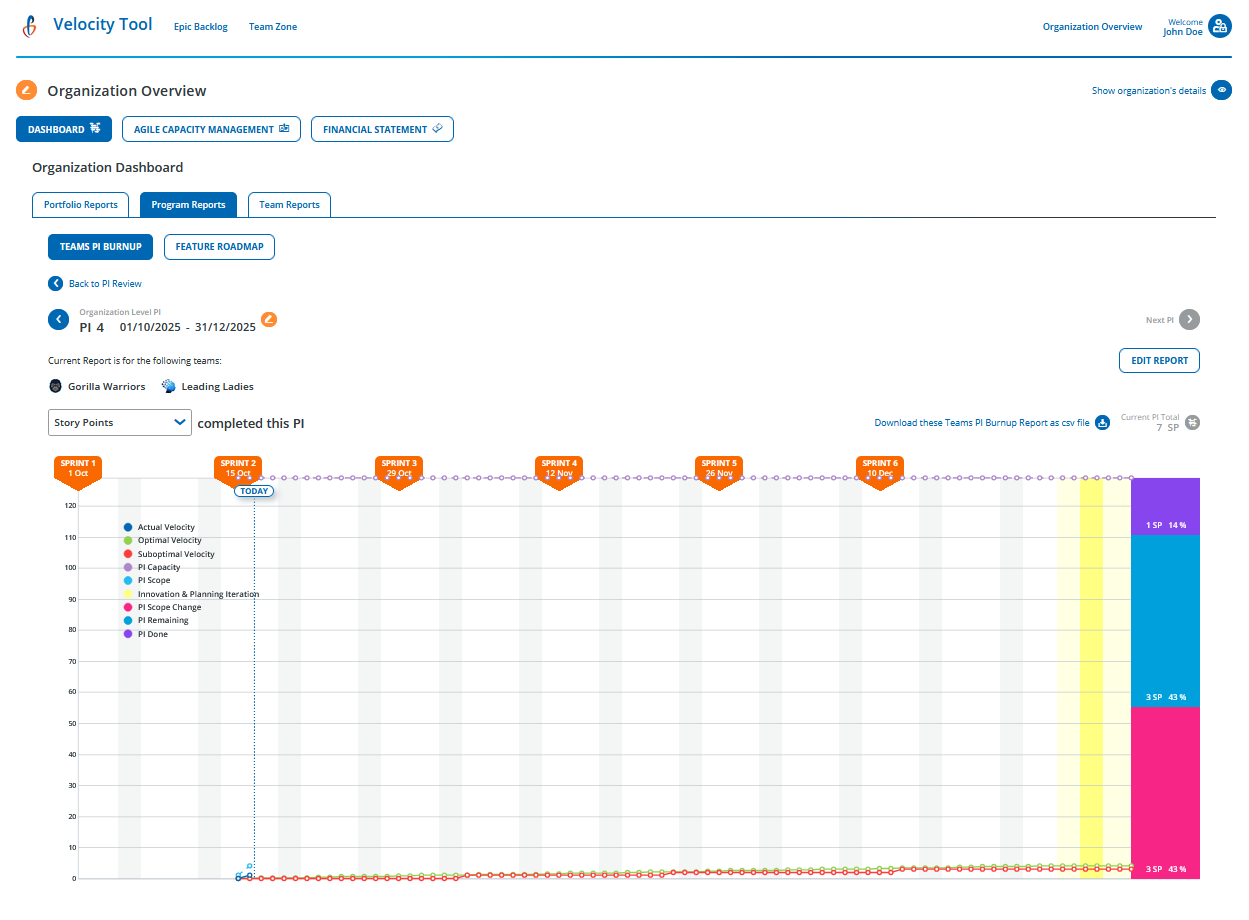
PI Burn-Up chart: Shows how much work has been completed and how total scope changes. Great for visualizing progress and managing scope changes over time.
-
Team and Program-level performance metrics.
- Financial tracking across the PI
The purpose is to give leadership and teams a clear picture of how value is being delivered over time.
Planning Interval Reports – Teams
PI Burn-Up Chart for Teams and Program Level
Tracks progress of multiple teams and the program toward PI Objectives over time.


